COVID-19 Study
Scientific Findings
Demographics
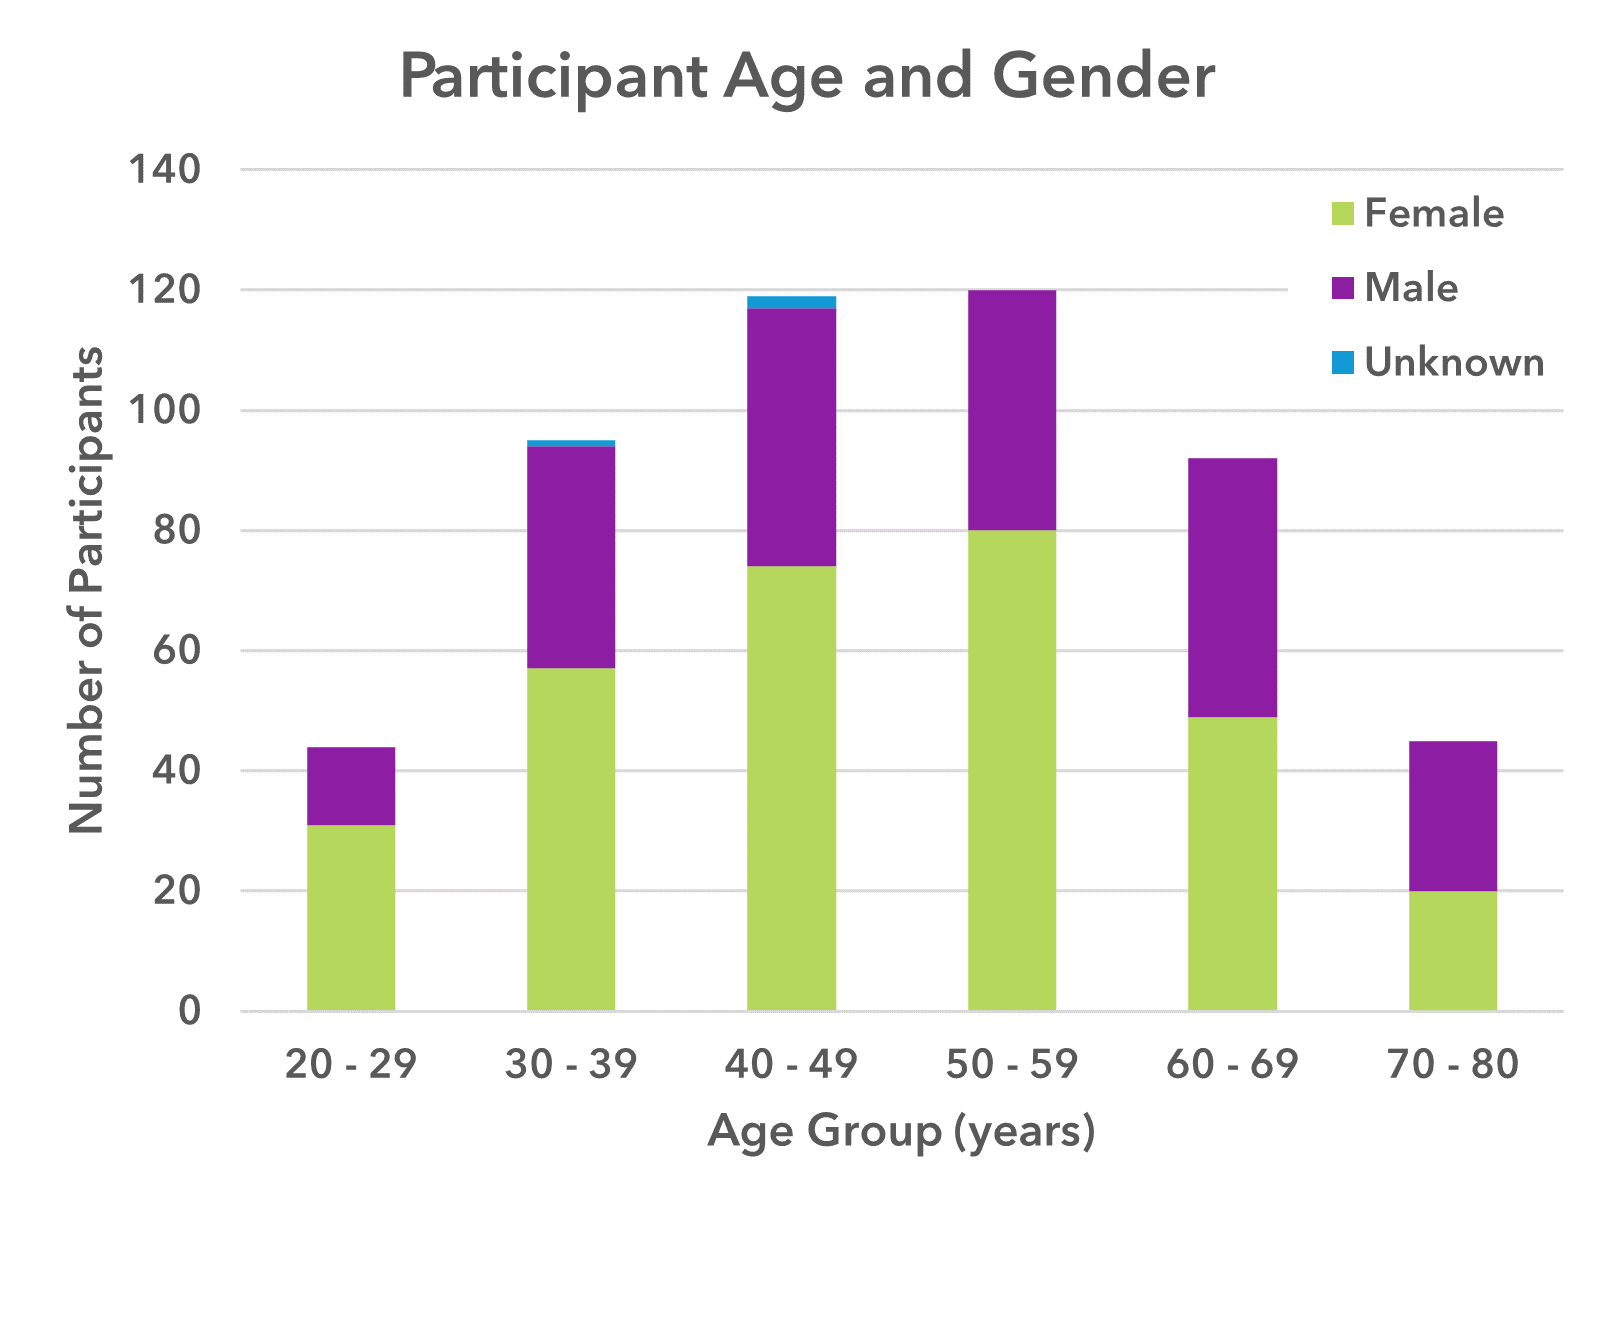
513 participants whose blood samples were analyzed
61% female, 39% male
Ages range from 20 to 80 years old
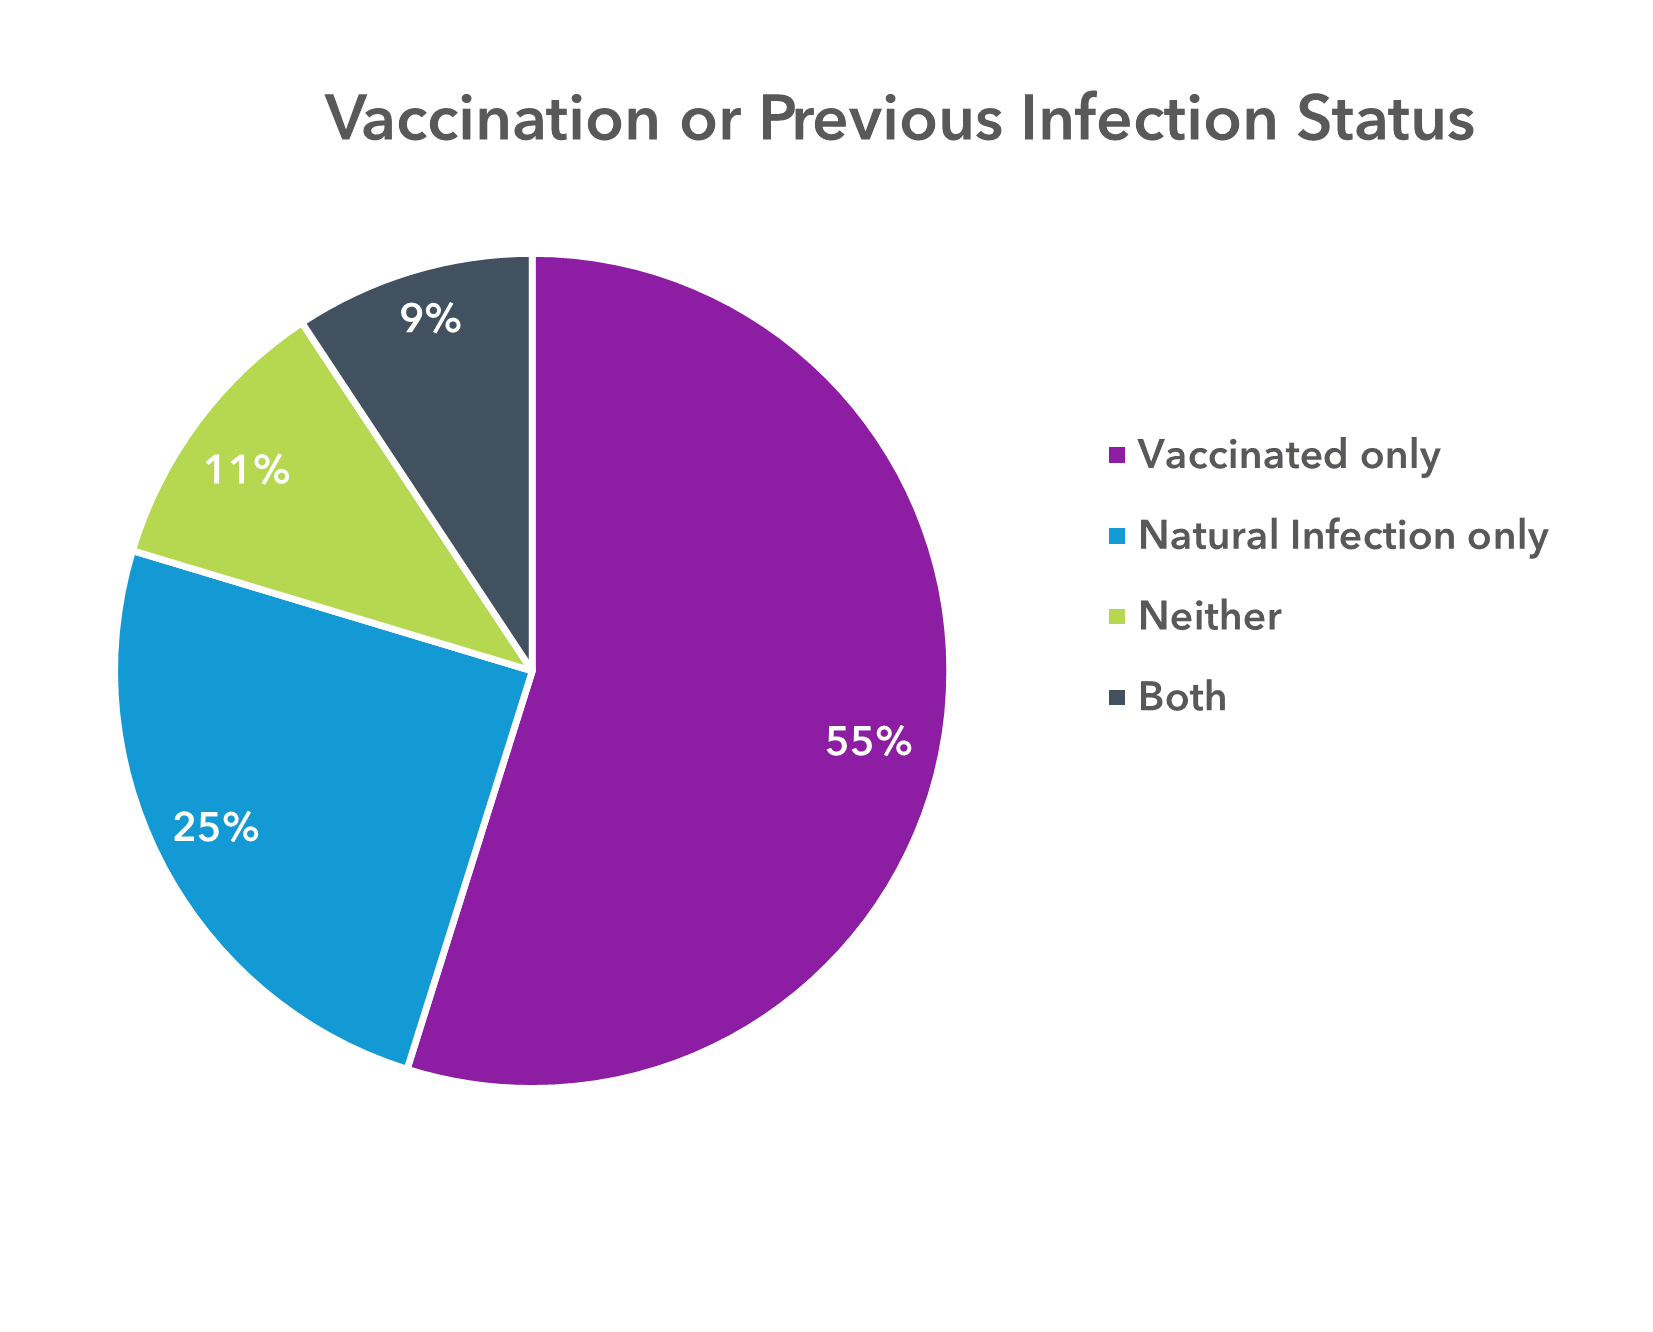
55% received a vaccine against COVID-19 and had no COVID-19 infection
25% had natural COVID-19 infection and did not receive vaccination against it
Natural Response
Antibody Responses in Natural COVID-19 Infections
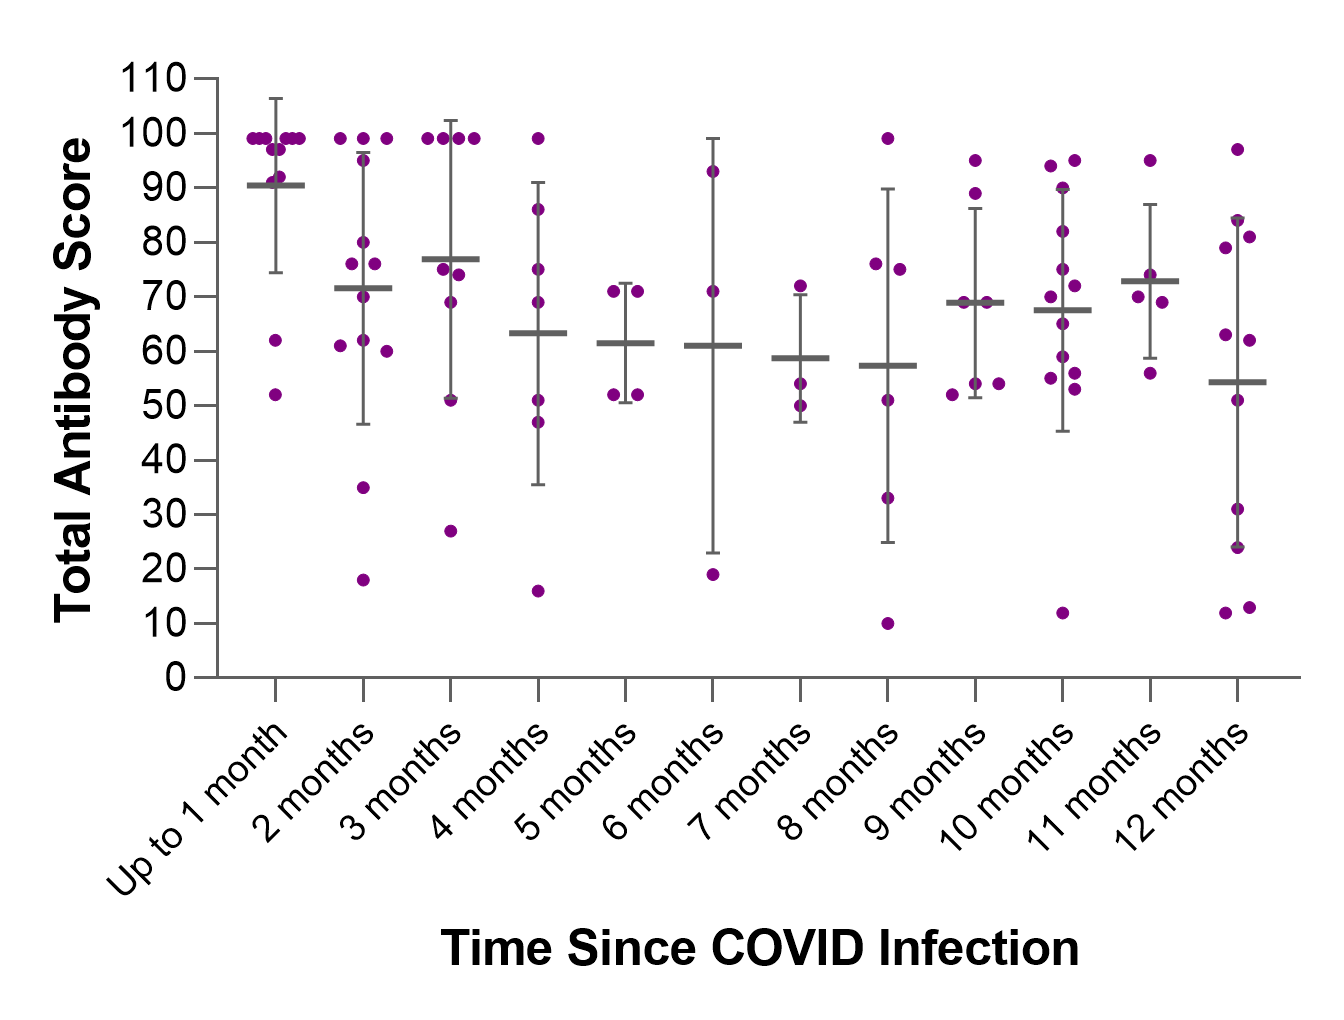
Total Antibody Score in Natural COVID-19 Infection
The Total Antibody Score (TAS) measures the quantity of IgG antibodies to the SARS-CoV-2 virus.
TAS values for each participant are shown as individual dots grouped by the number of months since infection.
The mean and standard deviation (grey bars and vertical lines, respectively) are shown for each time point.
If you had a natural infection, you can compare your TAS to those in the appropriate group based on how long ago you had your infection.
Is your TAS close to the average, or above or below it? Is it within or outside the standard deviation for that group?
Time Post Natural COVID Infection


These heat maps show the diversity of circulating antibodies in participants with natural infections, grouped by time since their infection.
The rows numbered 1 – 52 each represent a unique target (epitope) on the SARS-CoV-2 virus. Each column represents a given participant. Each square is colored based on the level of antibodies (none, low, medium or high) against each target, detected in each participant’s sample.
- Note how diverse people’s antibody responses are.
- Note how, in general, the levels of antibodies go down with time.
- The decline in antibody levels is more noticeable for the targets on the bottom part of the figure, which comprise some epitopes on the Nucleocapsid protein and Non-structural Protein 8 of the virus.
- In contrast, antibodies against the Spike protein tend to be more long lived, and detectable even after 12 months after infection.
Acute COVID-19 Infection
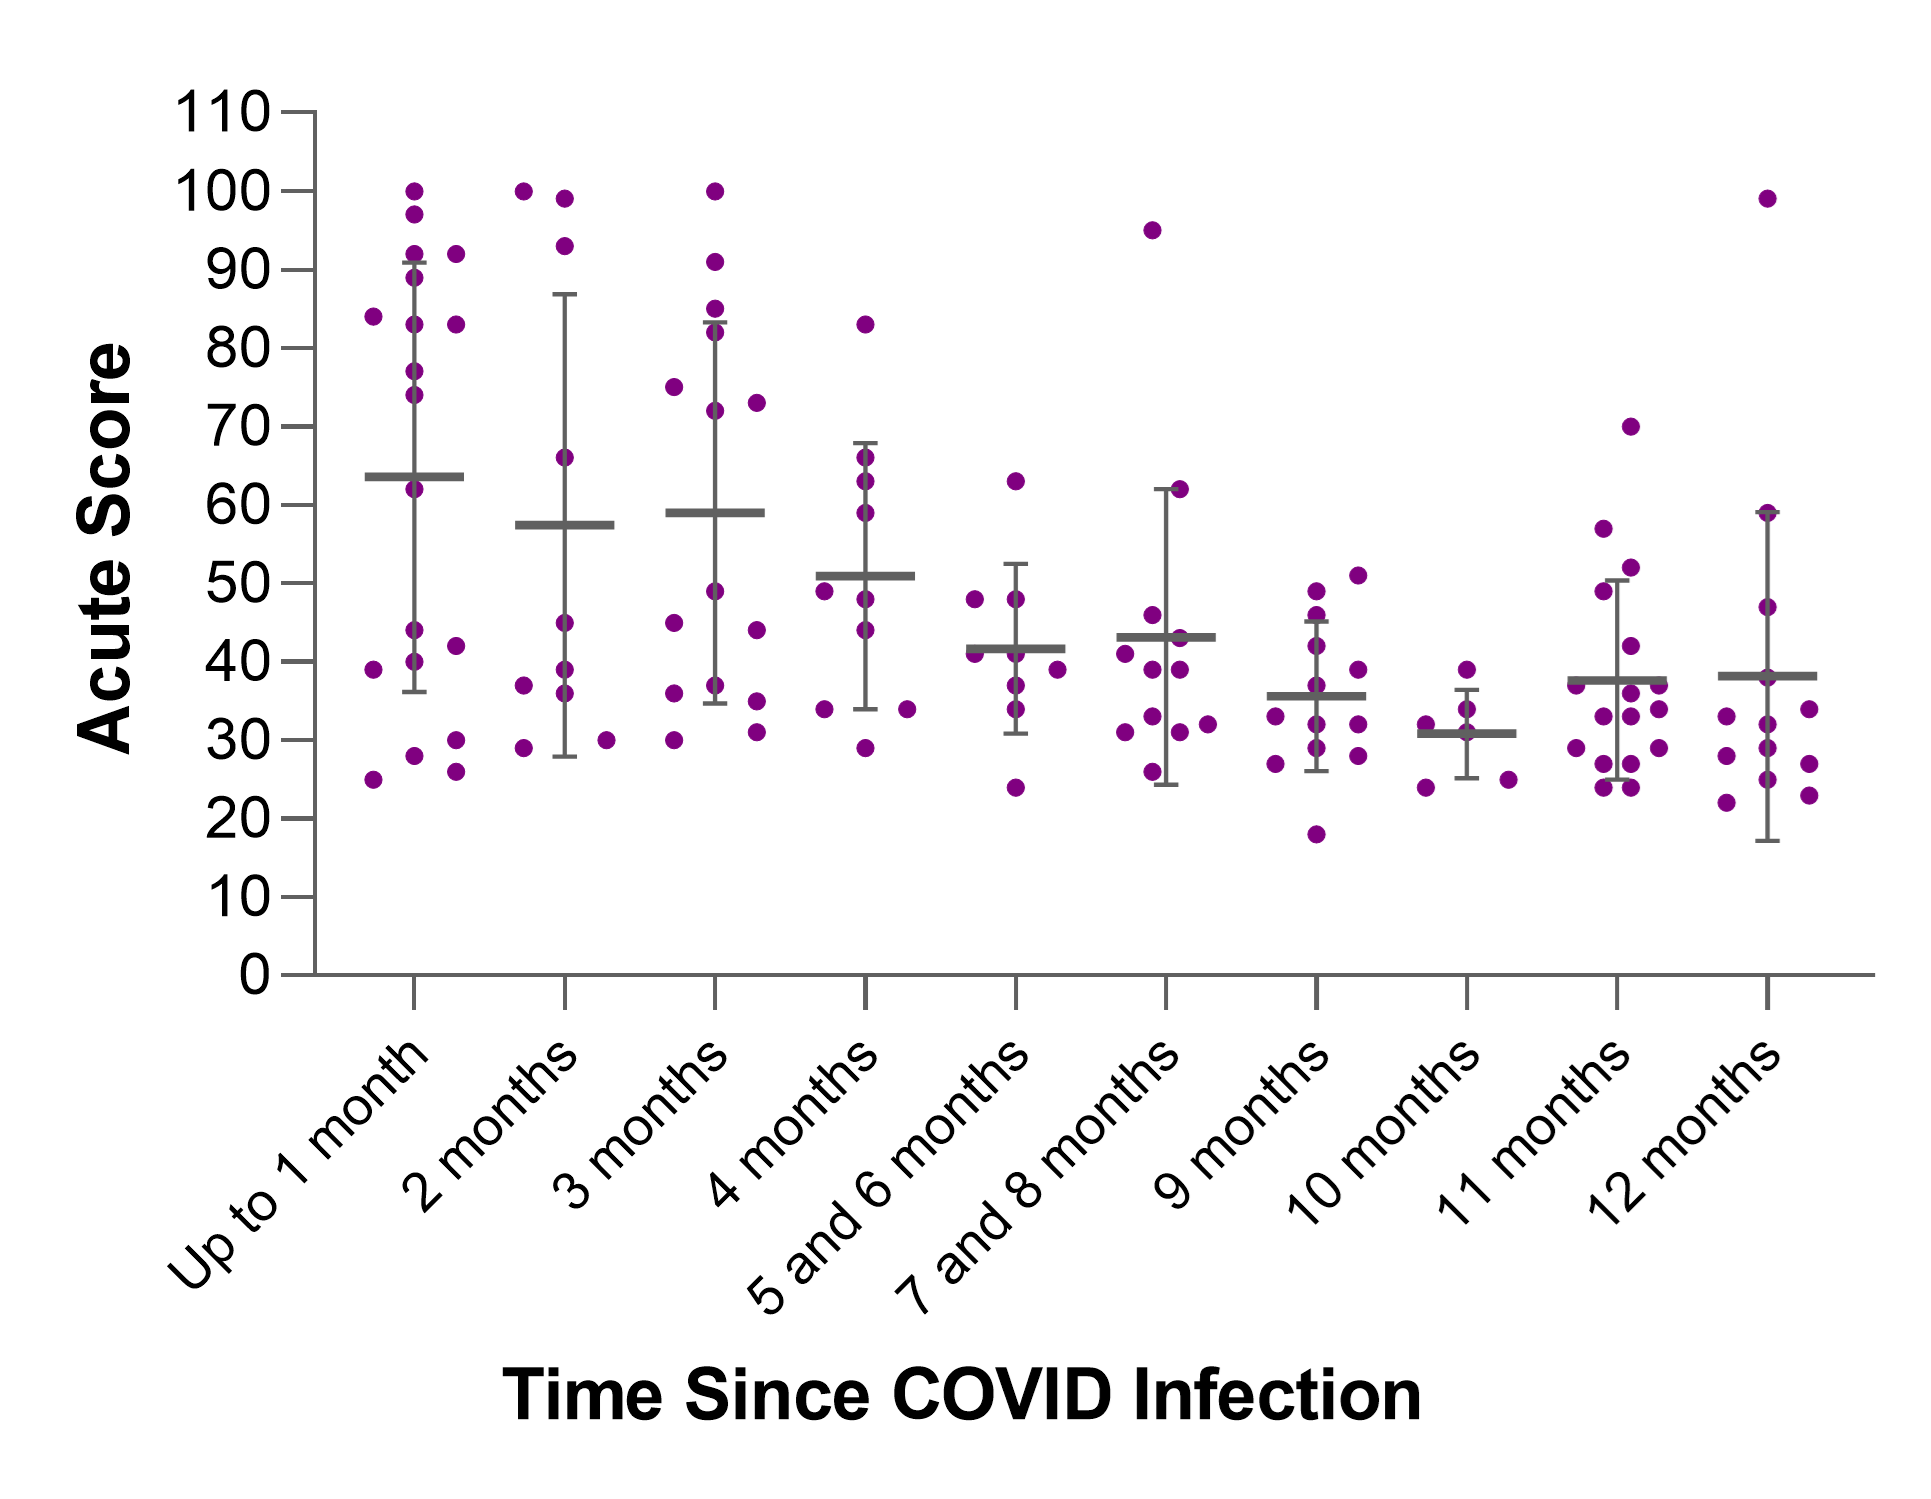
The Acute Score represents the level of IgM antibodies to SARS-CoV-2 in a sample, which is indicative of a recent or acute infection. IgM presence declines rapidly as other forms of antibodies (like IgG) are produced by the body.
The Acute Score for each participant is shown by the number of months since infection.
The mean and standard deviation (black bars and vertical lines, respectively) are shown for each time point.
- Note how Acute Score values drop more quickly than the Total Antibody Score from the previous graph.
- Note the outlier high values at 7 – 8 and 12 months. As we gather more data, we want to investigate whether these high levels of IgM show correlations with either protection from reinfection or specific symptoms or severity of COVID.
Vaccine Response
Antibody Responses to COVID-19 Vaccine
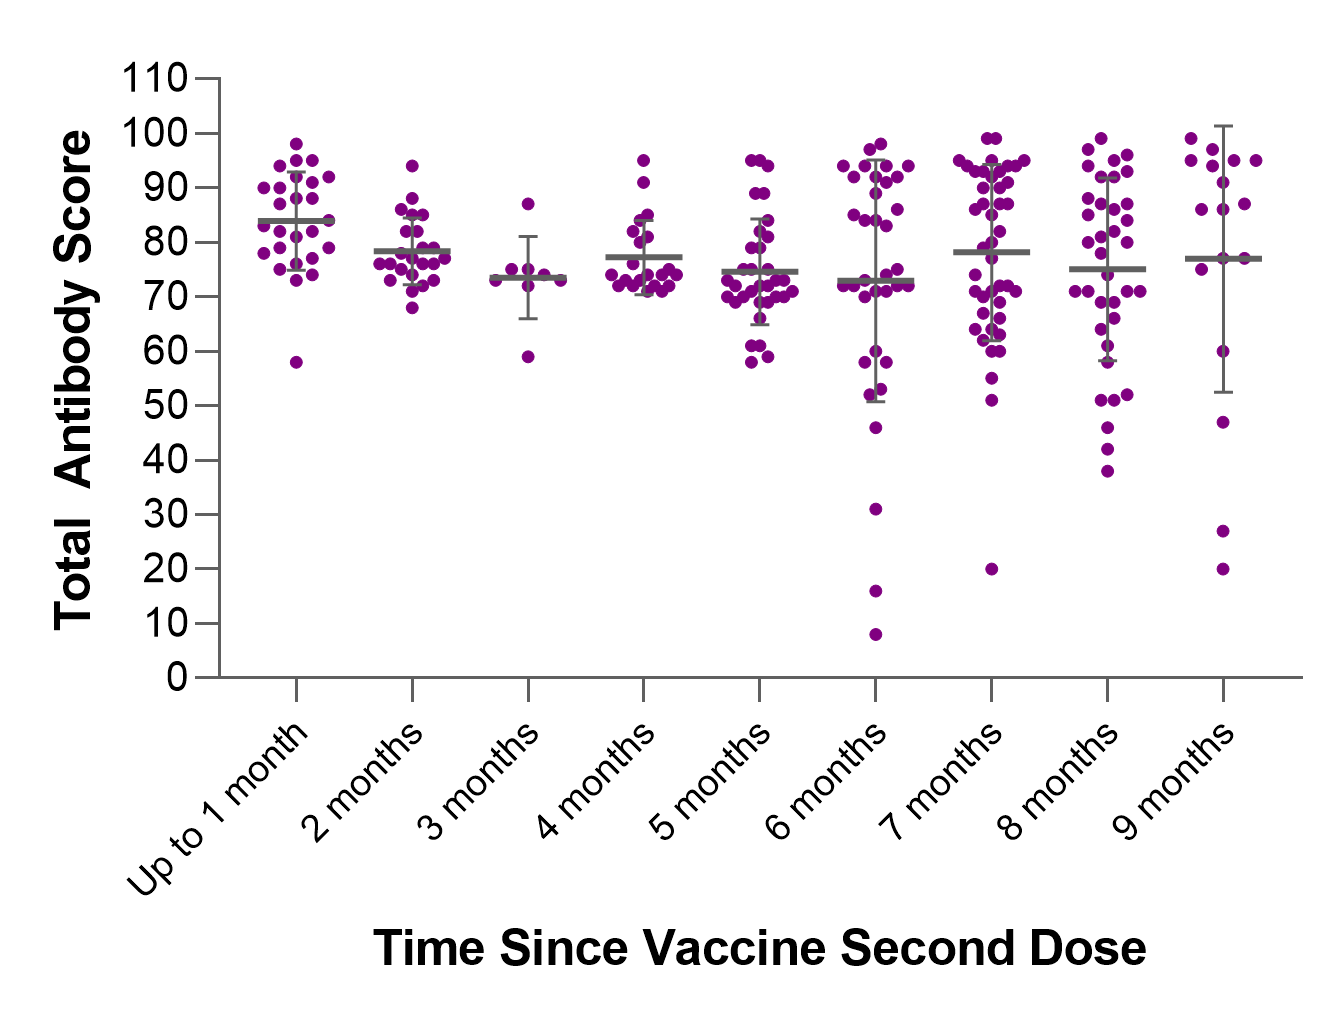
Total Antibody Score in Participants Vaccinated against COVID-19
The Total Antibody Score (TAS) measures the quantity of antibodies to the SARS-CoV-2 virus.
TAS values for each participant are shown as individual dots grouped by the number of months since vaccination.
The mean and standard deviation (grey bars and vertical lines, respectively) are shown for each time point.
If you received a vaccine against COVID-19, you can compare your TAS to those in the appropriate group based on how long ago you got vaccinated.
Is your TAS close to the average, or above or below it? Is it within or outside the standard deviation for that group?
Time Post Vaccine Second Dose
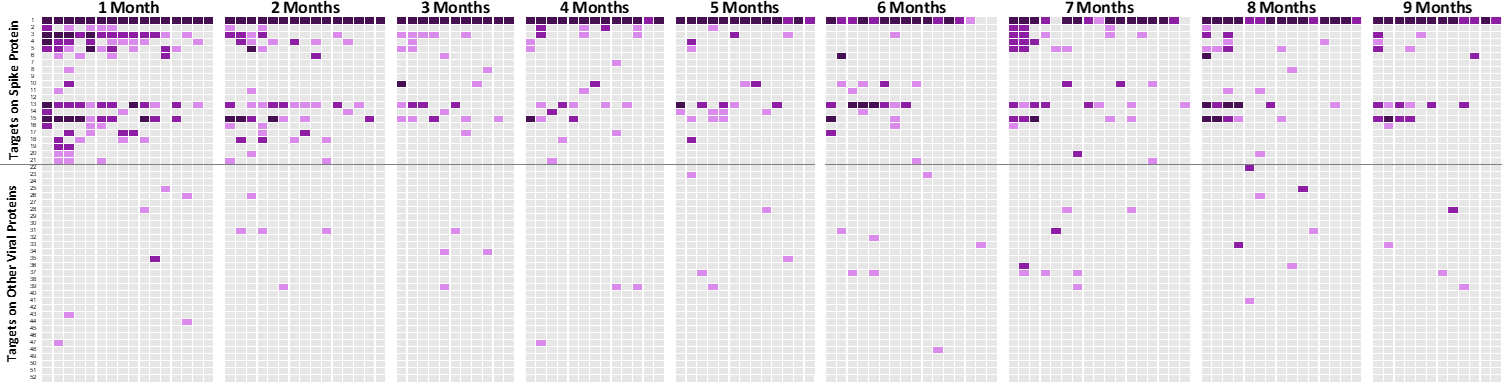
These are example heat maps of the diversity of circulating antibodies in vaccinated participants, grouped by how long ago they received their second dose.
COVID-19 vaccine uses the virus’ Spike glycoprotein to elicit a protective immune response in the body. The rows numbered 1 – 21 each represent a unique target (epitope) on this protein. Each column represents a different participant. Each square is colored based on the level of antibodies (none, low, medium or high) against each target, detected in each participant’s sample.
- Note how some targets are recognized by many people, but others are less commonly recognized. We capture both the common and the rarer antibody types a person makes.
- Note how diverse people’s antibody responses are against the vaccine.
- Note how antibodies to some targets appear to be more long lived (like 13 and 15), and others are lost rapidly (like targets 2 – 5).
Before Booster Sample Taken

Effect of vaccine booster on circulating antibodies to SARS-CoV-2 Spike protein
This figure shows pairs of samples collected before and after the participant received a vaccine booster shot.
For each pair, the Before sample was taken 4, 5 – 6 or 7 – 8 months after the second vaccine dose.
The After sample was taken between 2 weeks to 2 months after the booster shot.
- Note how the booster increases the amounts of low-level circulating antibodies for some targets.
- Note how it also brings back antibodies that were no longer detected in the blood. This does not necessarily mean that the antibodies were no longer present, as they could be at levels too low for us to detect.
- This data suggests that the vaccine boosters increase both the amount and the diversity of circulating antibodies.
Breakthrough Infections
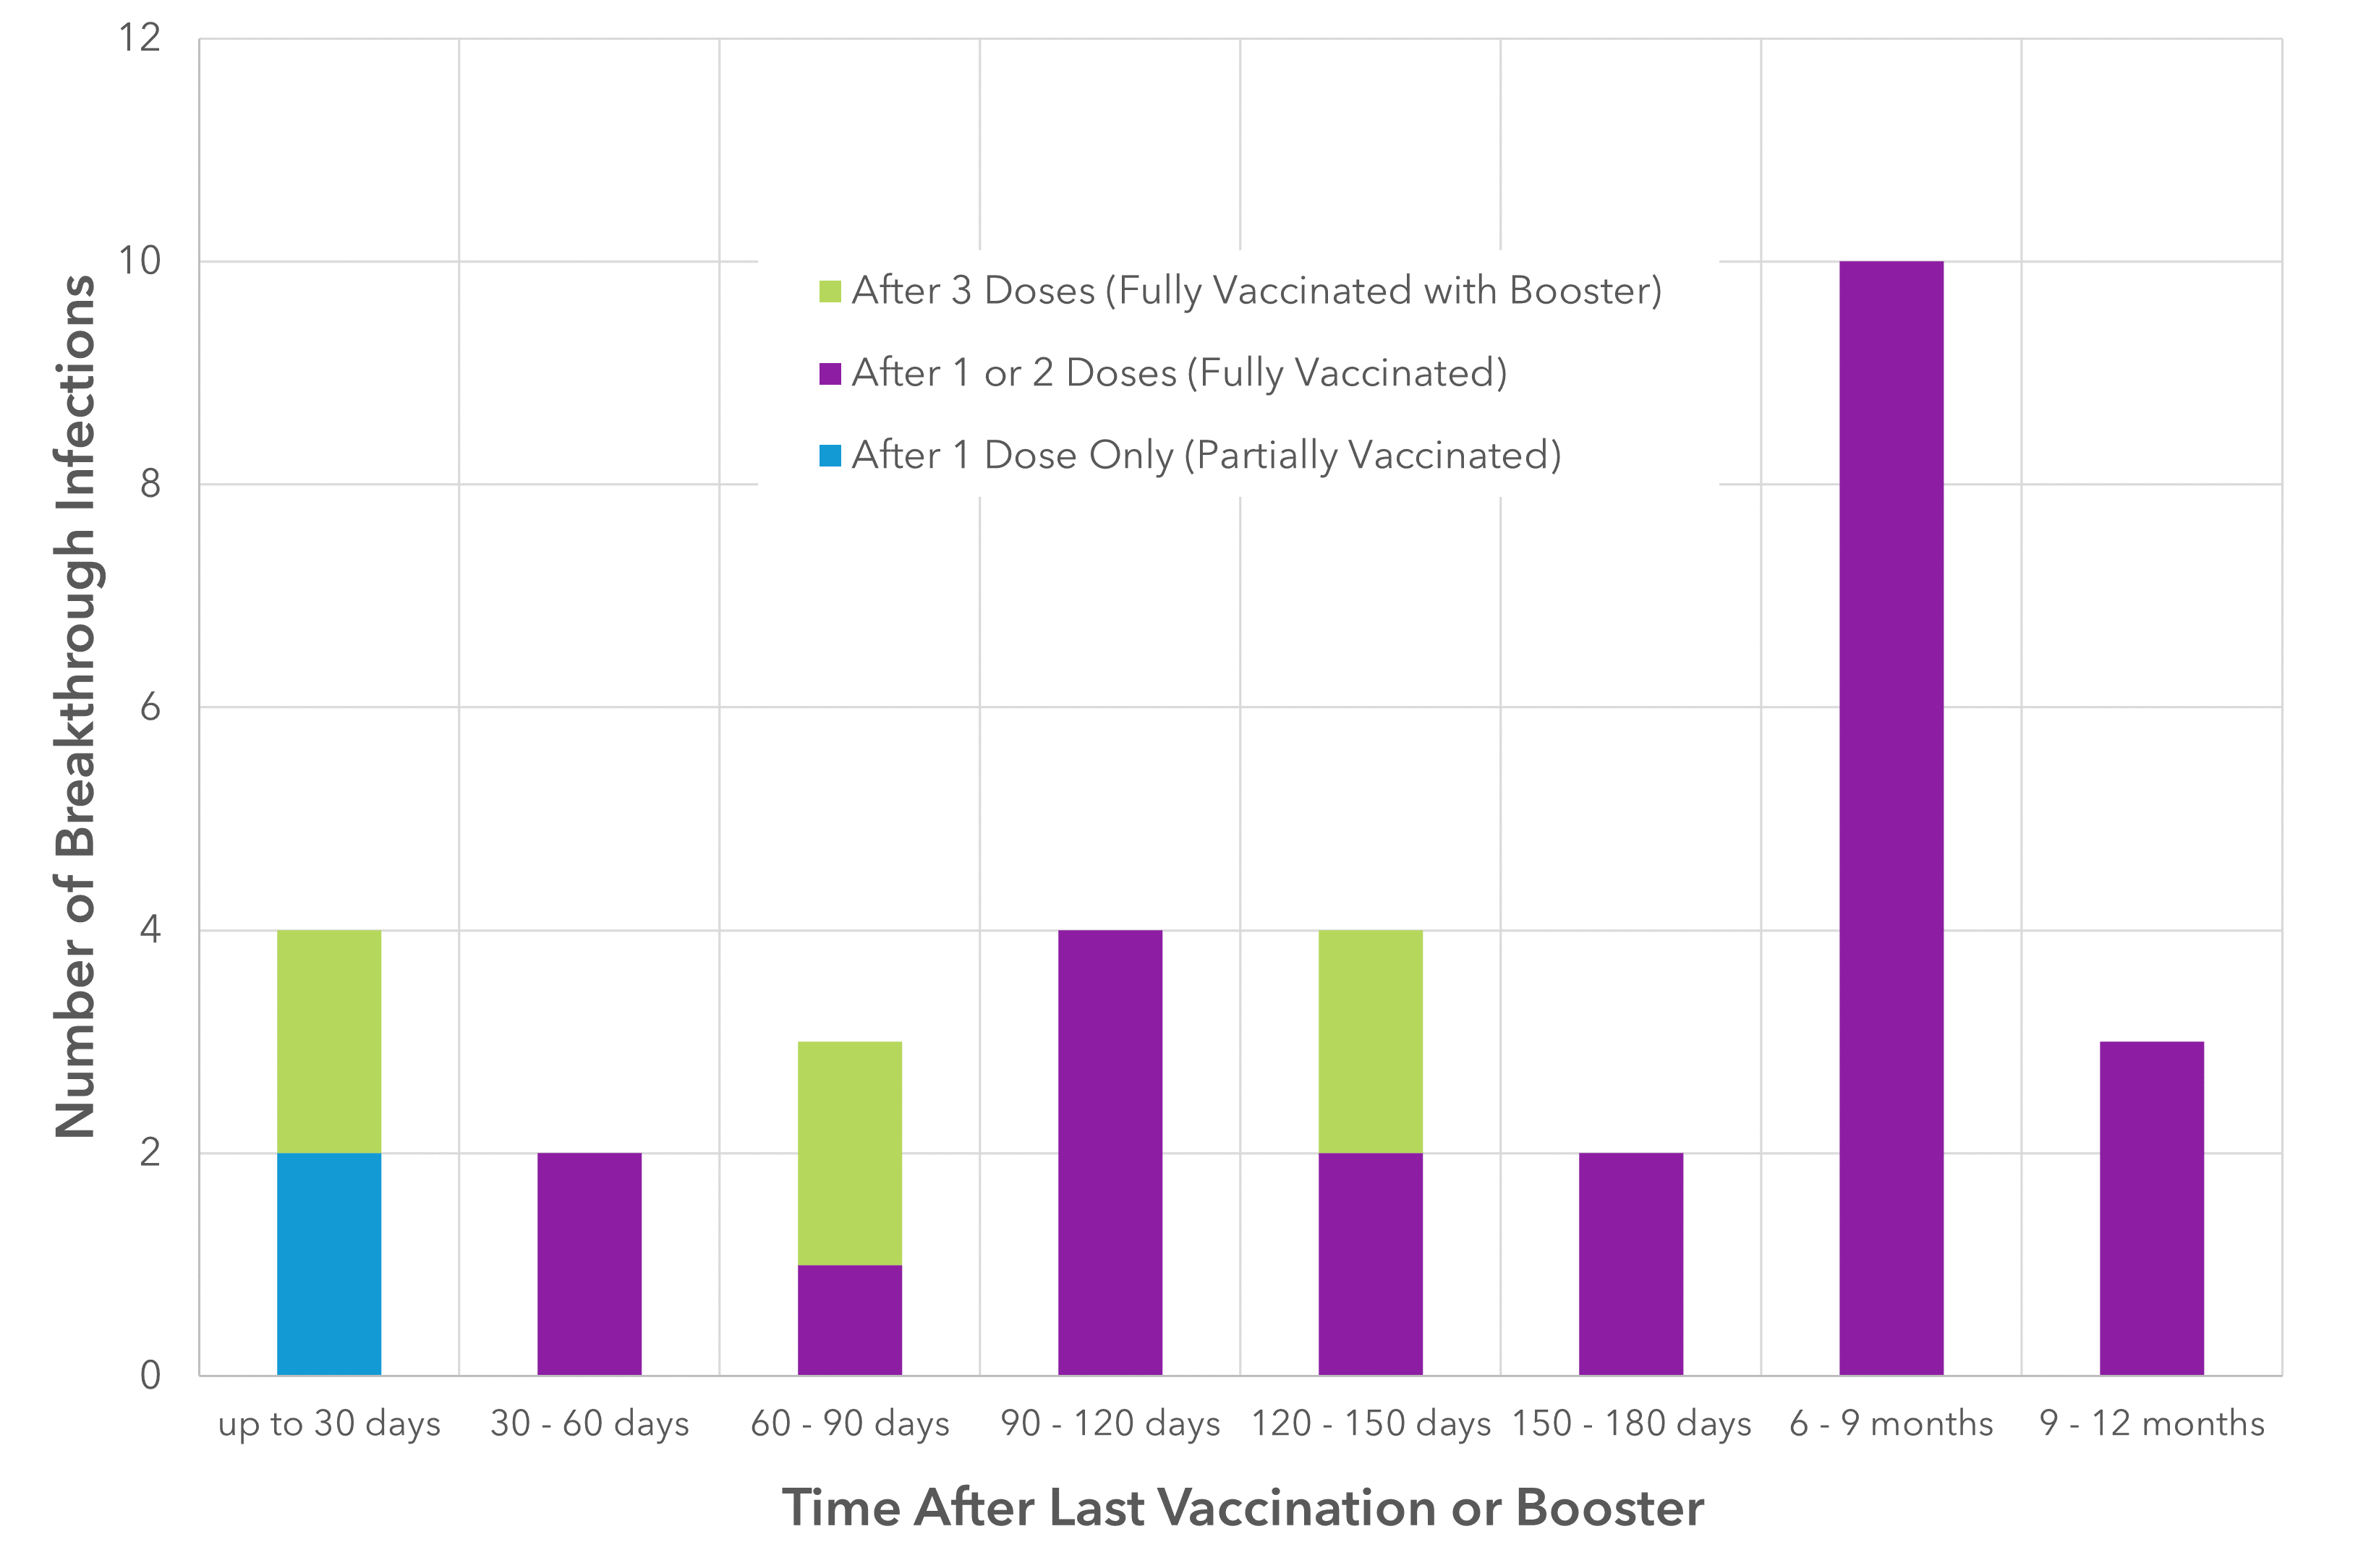
- Of 551 participants vaccinated against COVID-19, 32 (5.8%) experienced breakthrough infections.
- Most commonly, breakthrough infections occurred 6 – 9 months after being fully vaccinated.